


May 2025 | Keaney Financial Services Corp. Commentary
Authored by our investment advisory team
A Simple Explanation: What Is the Gold–Silver Ratio?
The gold–silver ratio is among the oldest metrics for evaluating precious metals markets. It measures how many ounces of silver are equivalent to one ounce of gold. Suppose gold is priced at $2,000 per ounce and silver is priced at $25 per ounce. In that case, the ratio is 80:1
Formula: (Gold price (per ounce) / Silver Price (per ounce) = Gold-to-Silver ratio)
Historically, this ratio has moved in cycles and can be a valuable tool for identifying relative mispricing between the two metals.
For much of the 20th century, the ratio ranged between 40:1 and 60:1. In more recent decades, since the 1970s when both metals were allowed to float freely in the market, the ratio has averaged closer to 65:1 to 70:1. A high ratio suggests silver is inexpensive relative to gold — a potential buying signal for value-focused investors1.
Historical Perspective: When the Ratio Spiked Above 100
The gold–silver ratio has rarely exceeded 100 in the past 100 years. In fact, before 2020, it had never crossed that level in modern financial history. Here are a few notable times it approached or exceeded that threshold:
1939: The ratio approached 98:1 during the late stages of the Great Depression, driven by government gold revaluation and weak silver demand2.
1991: The ratio again peaked around 97.5:1 as silver fell to multidecade lows under $4/oz amid soft industrial demand3.

2020: During the peak of the COVID-19 market panic, the ratio surged above 125:1 — the highest ever recorded — as silver plummeted relative to gold in March and April4.
In 2020, the ratio remained above 100 for approximately 6–8 weeks, from late March through mid-May. It quickly reversed as silver prices recovered and outpaced gold in the second half of that year.

Today, in 2025, the ratio hovers between 87:1 and 102:1, which is elevated well above its historical average5.
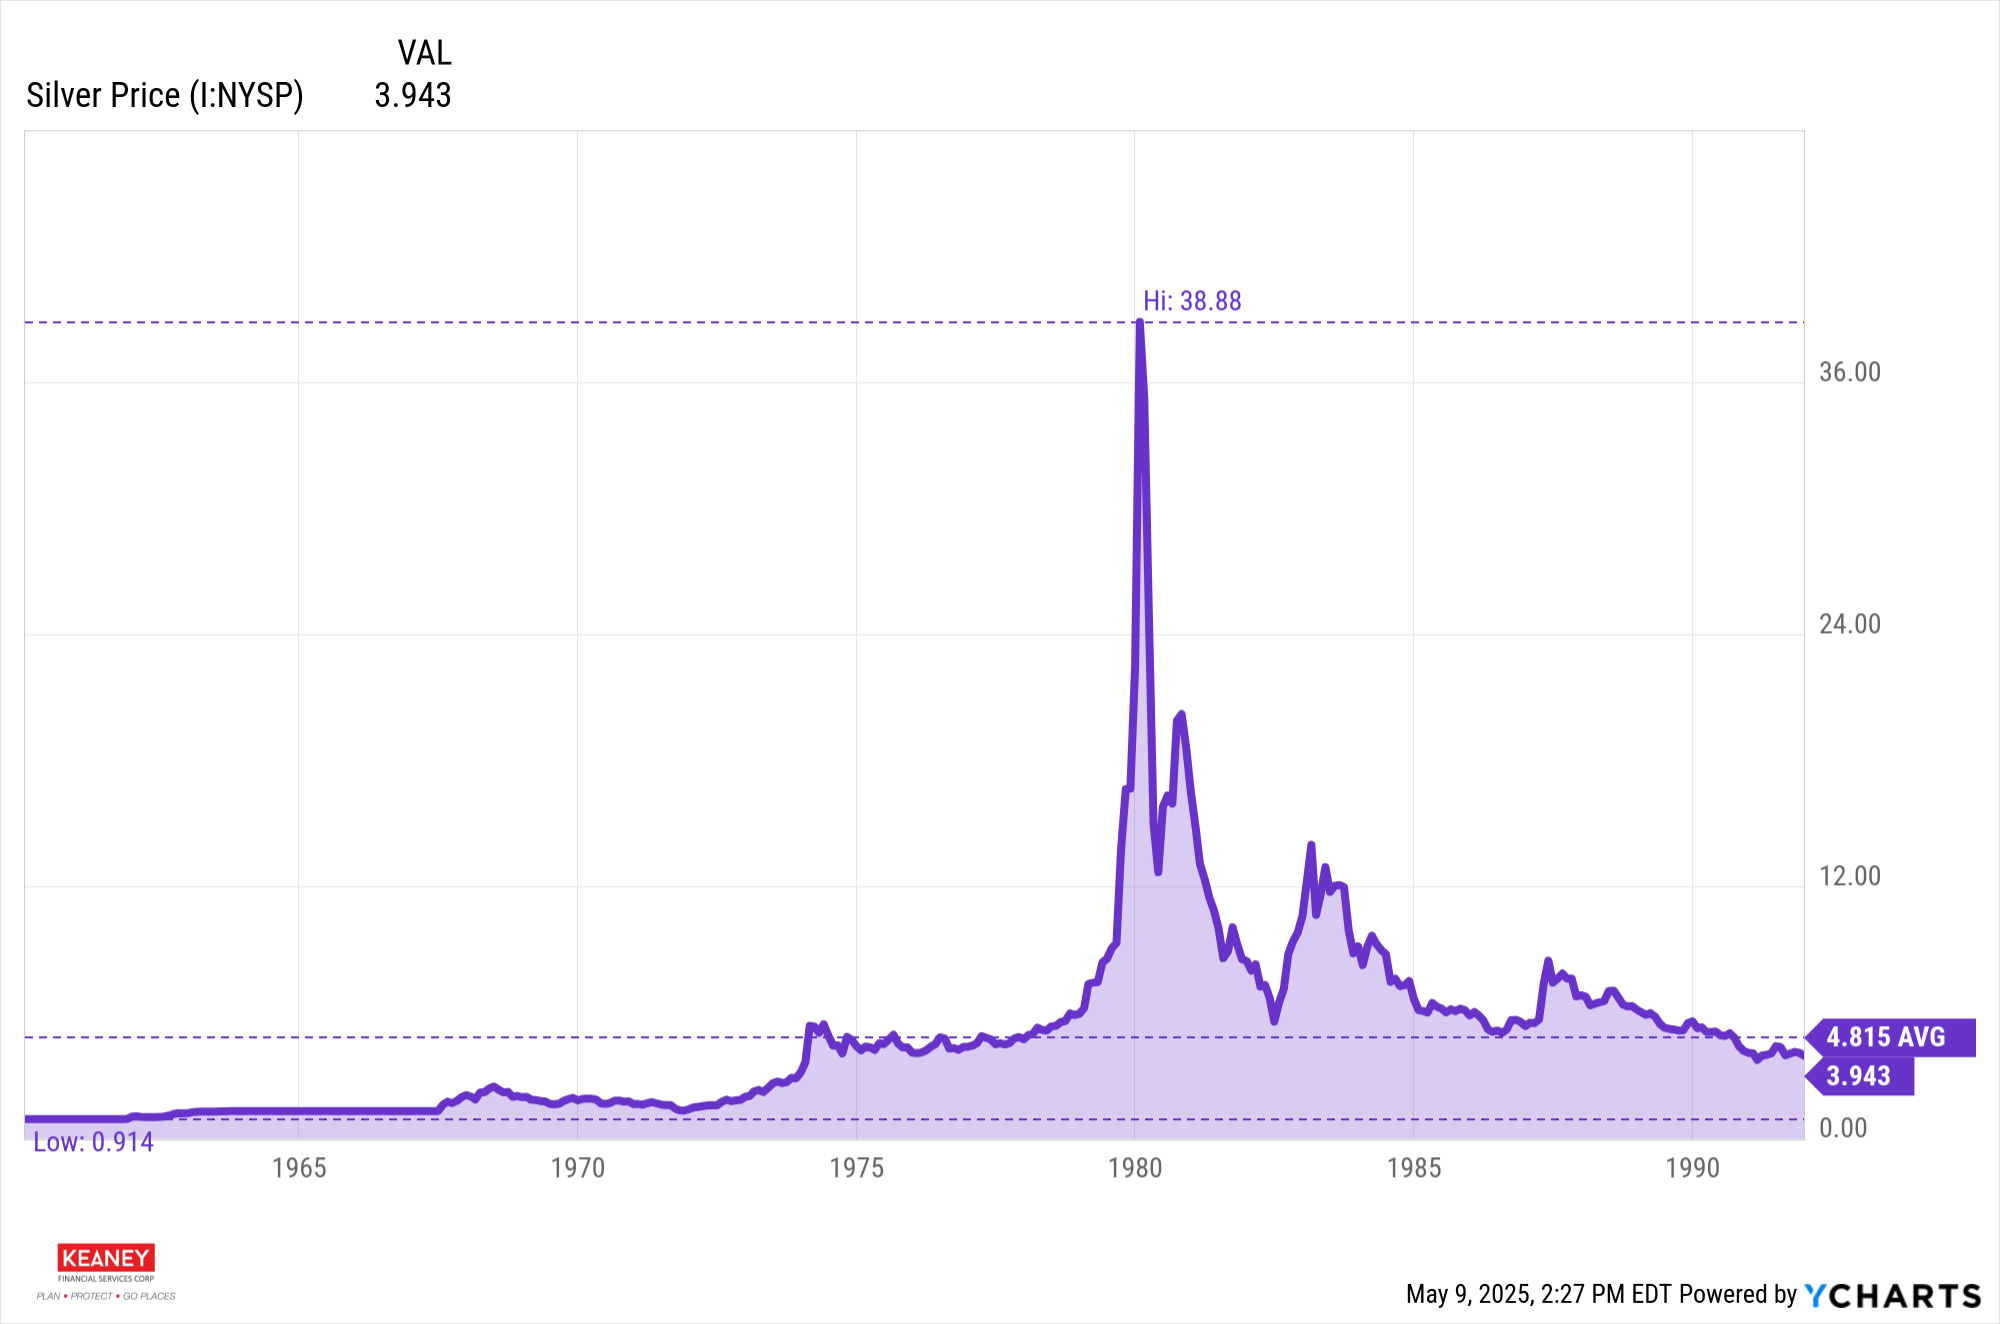
As seen in the chart below, silver was trading at $38.88 in 1980 compared to the current price of $32.23. From a tactical perspective, the current ratio indicates that silver is historically undervalued. This is a 17% discount from the high of the 1980s. The data suggests that silver could be poised to perform well in both the short term and the long term.

Here are several key factors we see in the upcoming cycle:
1. Supply and Demand
Global demand for silver reached a record 1.2 billion ounces by the end of 2024, led by growth in solar panels, electronics, and electric vehicles6.
Simultaneously, mining production has struggled to keep pace, creating a multi-year supply deficit that continues to widen into 2025.
Tightening the supply-demand balance currently supports a higher price potential, particularly as industrial demand accelerates.
2. Silver's dual role as a precious metal and an industrial asset
It benefits from both economic growth and macroeconomic uncertainty.
Silver also tends to perform well as a store of value in an inflationary or weak-dollar environment, similar to gold, and is known to be purchased by retail investors when they're "priced out" of gold (when the price per ounce is too high they can't afford to buy the metal).
Silver's industrial use case drives demand in expansionary cycles, giving it additional upside potential.
3. Historical Reversion Patterns
Following the 1991 and 2020 peaks in the gold–silver ratio, silver prices significantly outperformed gold over the following 6–24 months.
Like most investments, silver's mean–reverting tendency has played out consistently in past cycles, strengthening the case for increased silver exposure when the ratio exceeds 85–90. ("Mean Reversion" is a financial theory that returns and assets prices will eventually revert back to their long-term historical average over time.)
Historical Peaks in Silver Prices
To further contextualize silver's potential, it's helpful to look at its nominal price peaks over the past century:
Year Peak Silver Price Context
1980:
2011:
2020:
Today (May 2025), silver is trading in the $22–$34.87 per ounce range10, down significantly from its past peaks, but with strong underlying demand drivers and favorable comparative value.
As investment advisors actively monitoring long-term valuation cycles and short-term price inefficiencies, we believe the gold–silver ratio provides a compelling lens into relative value in today's markets. With the ratio well above historical averages and silver's industrial and monetary demand strengthening, we see merit in increasing tactical exposure to silver over the near to medium term. The gold-silver ratio alone is just one of the factors we use to enter or hold the portfolio position.
While every cycle is unique, history suggests that high gold–silver ratios rarely persist indefinitely, and when they normalize, silver has outperform.
References:
Investopedia. “Gold-Silver Ratio: What It Is and How to Use It.” https://www.investopedia.com/terms/g/gold-silver-ratio.asp↩
TradingView. “Gold/Silver Ratio – Historical Chart.” 1939 peak data available via custom timeframe analysis. ↩
YCharts.
CME Group. “Gold-Silver Ratio Hits Record High Amid Pandemic.” April 2020. https://www.cmegroup.com↩
TradingView. Real-time XAU/XAG ratio as of April 2025. https://www.tradingview.com↩
Silver Institute. World Silver Survey 2024.https://www.silverinstitute.org↩
U.S. Geological Survey (USGS) & MacroTrends. “Historical Silver Prices.” https://www.macrotrends.net↩
LBMA Data & World Gold Council. April 2011 silver and gold price charts.
Bloomberg. “Silver Prices Rebound After COVID Shock.” August 2020.
Disclosure & Disclaimer
The content provided in this commentary reflects the opinions of Keaney Financial Services Corp. as of the publication date. It is intended solely for educational and informational purposes. It should not be construed as individualized investment advice, a solicitation to buy or sell any security, or a recommendation for any particular investment strategy. All views are subject to change without notice based on evolving market, economic, or political conditions. While we strive to ensure accuracy, the information presented is based on sources believed to be reliable, but we make no guarantee as to its completeness or accuracy.
The opinions shared herein are those of our advisors and are not intended to represent the position of any regulatory agency, organization, committee, group, individual, or third-party institution. Consult your qualified financial, legal, or tax advisor before making investment decisions.
Risk is an inherent aspect of all investment activities, and investors must recognize that no investment is entirely free from risk. Although important, asset allocation, risk management, and diversification strategies do not guarantee generating profits or shielding against losses.