


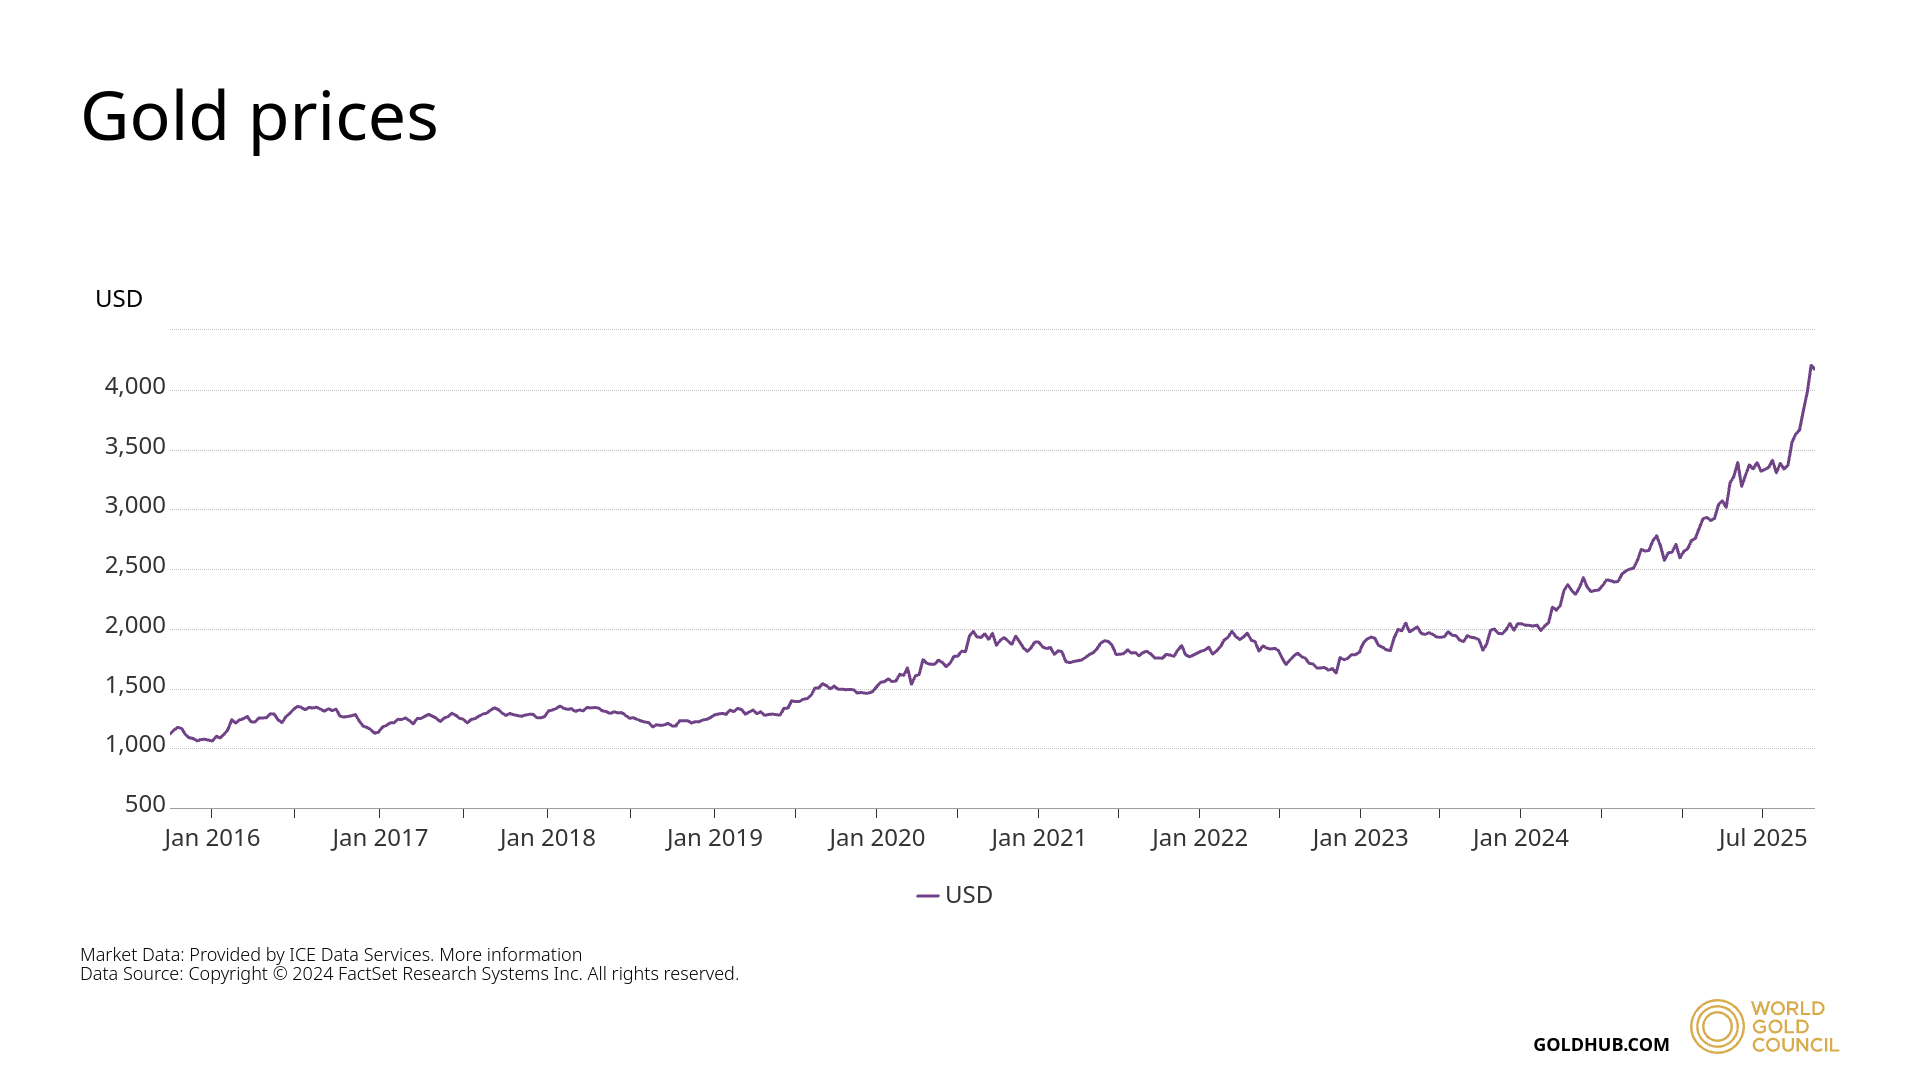
Over the last decade (October 2015 to October 2025), gold has been in a long-term bull market, rising from approximately $1,100 per ounce to over $4,300 per ounce, representing a gain of more than 290%. However, this significant upward trajectory has been characterized by periods of notable volatility, including seven distinct corrections, defined as price drops of 10% or more from recent highs. These episodes are a normal feature of market cycles. They are often triggered by shifts in U.S. Federal Reserve monetary policy, the strength of the U.S. dollar, or changes in broader investor risk appetite. This report provides a detailed, data-driven analysis of each of these seven corrections, offering historical context on the primary drivers of gold's price and its recovery dynamics.
Important Risk Disclosures
This commentary is for informational purposes only and is based on an analysis of historical market data. It contains forward-looking statements based on current market conditions that are not guarantees of future performance. The commodities markets are complex and subject to rapid changes. Investing in commodities, including gold, involves a high degree of risk and is not suitable for all investors. The price of gold is volatile. Past performance is not indicative of future results. Investors should carefully consider their investment objectives and risk tolerance before making any investment decisions, and may lose a substantial portion or all of their investment. This material should not be considered a recommendation to buy or sell any security.
Our Educational Approach
At Keaney Financial Services Corp., our primary goal is to empower clients to make educated financial decisions. We believe that a deep understanding of market history is essential for navigating future uncertainty with confidence. Our long-term allocation to tangible assets, such as gold, is a core component of our structural investment themes in the KFSC Risk Managed Strategies. We believe it is critically important for clients to understand the nature of volatility. Bull markets rarely move in a straight line. By analyzing the frequency, depth, and cause of past corrections, we can better frame what normal market behavior looks like, helping to distinguish between a temporary pullback and a fundamental change in the long-term trend (13).
Historical Price Overview (2015-2025)
Gold's price trajectory over the decade reflects a classic bull market structure: a grinding base-building phase (2015-2018), explosive crisis-driven rallies (2019-2020), partial retracements (2021-2022), and renewed institutional fervor (2023-2025). Annual closing prices (in USD per troy ounce) highlight the volatility:
| Year | Year-End Close | Annual Return (%) | Key Note |
|---|---|---|---|
| 2015 | $1,060 | +0.3 | Bottomed near $1,050; end of multi-year bear market. |
| 2016 | $1,151 | +8.6 | Modest rebound amid Brexit uncertainty. |
| 2017 | $1,296 | +12.6 | Steady gains as U.S. dollar weakened. |
| 2018 | $1,281 | -1.2 | Flat year; late correction from Fed hikes. |
| 2019 | $1,523 | +18.9 | Strong rally on trade war fears. |
| 2020 | $1,895 | +24.4 | Pandemic surge; all-time nominal high ~$2,070. |
| 2021 | $1,829 | -3.5 | Correction on vaccine rollout and rate hike signals. |
| 2022 | $1,824 | -0.3 | Sideways amid inflation peak; 15% mid-year drawdown. |
| 2023 | $2,062 | +13.1 | Recovery on banking crisis (SVB collapse). |
| 2024 | $2,639 | +27.9 | Geopolitical tensions (Ukraine, Middle East) fuel demand. |
| 2025 | Around $4,115 (as of Oct 21) | +49.8 (YTD) | Record highs >$4,379; current pullback from overbought levels. |
Data compiled from World Gold Council, Macrotrends, Visual Capitalist, YCHARTS, and Trading Economics; 2025 YTD reflects spot price volatility as of October 21, 2025.
The average annual returns are around 10.9% over the period, but intra-year swings often exceed 20%, underscoring gold's dual role as both a safe-haven and speculative asset.
Analysis of Major Gold Corrections (2015-2025)
The following sections detail the seven significant corrections in the gold market over the past decade.
1. Late 2015 - Early 2016: Federal Reserve's Interest Rate Hiking Cycle
- Approximate Dates: October 2015 to February 2016
- Percentage Drop: Approximately 11%
- Details: The price of gold declined from a peak of approximately $1,180 to a low of nearly $1,050 over a period of roughly four months (1).
- Primary Cause: The primary catalyst was the Federal Reserve's initiation of its first interest rate hike in nearly a decade in December 2015. This action signaled an end to the post-2008 era of ultra-loose monetary policy, which strengthened the U.S. dollar and increased the opportunity cost of holding non-yielding gold (2).
- Recovery: Gold bottomed in early 2016 and subsequently rallied over 25% by the middle of the year, driven by renewed global economic uncertainty and a pause in the Fed's hiking cycle (2).
2. Late 2016: Post-U.S. Presidential Election Correction
- Approximate Dates: November 2016 to December 2016
- Percentage Drop: Approximately 13%
- Details: In a sharp, short-lived move, gold fell from a pre-election high near $1,300 to a low of approximately $1,130 in just over a month (3).
- Primary Cause: The unexpected election result sparked a "risk-on" rally in equities and the U.S. dollar, fueled by expectations of pro-growth fiscal policies. After an initial safe-haven bid, capital rotated out of gold and into U.S. stocks. The Federal Reserve proceeded with another rate hike in December 2016, reinforcing the dollar's strength (3).
- Recovery: Prices stabilized by early 2017 and recovered as geopolitical tensions and a softening dollar brought investors back to the asset (4).
3. 2018: Prolonged Decline Due to Strengthening USD and Rising Rates
- Approximate Dates: January 2018 to August 2018
- Percentage Drop: Approximately 14%
- Details: Over a period of approximately eight months, the price of gold declined from a high of nearly $1,365 to a low of around $1,170 (5).
- Primary Cause: This correction was driven by a powerful combination of a strengthening U.S. dollar and a consistent series of Federal Reserve rate hikes, with four separate increases occurring during the year. Rising Treasury yields made non-yielding gold a less attractive asset to hold (5).
- Recovery: The recovery began in late 2018 and accelerated into 2019 after the Federal Reserve pivoted from hiking rates to cutting them amid signs of slowing economic growth (6).
4. March 2020: COVID-19 Liquidity Crisis Flash Crash
- Approximate Dates: March 6-16, 2020
- Percentage Drop: Approximately 15%
- Details: In a violent move lasting only about 10 days, gold plunged from a high of approximately $1,703 to a low near $1,452 (7).
- Primary Cause: This was not a fundamental shift away from gold, but rather a global liquidity crisis. The initial COVID-19 panic triggered margin calls across all asset classes, forcing investors to sell even safe-haven assets, such as gold, to raise cash.
- Recovery: The recovery was swift and decisive. In response to unprecedented global fiscal and monetary stimulus, gold rebounded over 40% to reach a new all-time high above $2,000 by August 2020 (7).
5. Mid-2020 to Early 2021: Post-Pandemic Stabilization Correction
- Approximate Dates: August 2020 to March 2021
- Percentage Drop: Approximately 19%
- Details: Following its record peak, gold entered a seven-month corrective phase, falling from approximately $2,075 to a low near $1,673 (8).
- Primary Cause: The rollout of COVID-19 vaccines and signs of economic reopening created a "risk-on" environment, reducing demand for safe havens. Rising U.S. Treasury bond yields further increased the opportunity cost of holding gold (9).
- Recovery: The price found a floor in March 2021 and began to climb again as it became clear that inflation was proving to be more persistent than initially expected (9).
6. 2022: Aggressive Fed Rate-Hiking Cycle
- Approximate Dates: March 2022 to November 2022
- Percentage Drop: Approximately 21%
- Details: In another extended eight-month decline, gold fell from a high near $2,050 to a low of approximately $1,620 (10).
- Primary Cause: To combat a 40-year high inflation, the Federal Reserve embarked on its most aggressive rate-hiking cycle in decades. This policy dramatically increased real interest rates and sent the U.S. Dollar Index soaring, creating powerful headwinds for gold (10).
- Recovery: The recovery began in late 2022 and gained momentum in early 2023 when the Federal Reserve paused its rate hikes and regional banking instability revived safe-haven demand (11).
7. Late 2024 - Early 2025: "Soft Landing" Expectations
- Approximate Dates: Late 2024 to early 2025
- Percentage Drop: Approximately 11%
- Details: Gold corrected from a high near $3,500 to a low of approximately $3,115 over a period of about two to four months (12).
- Primary Cause: This correction was driven by a shift in market sentiment toward the belief in an economic "soft landing," where inflation could be controlled without causing a recession. This reduced immediate demand for gold as a crisis hedge, leading to profit-taking after a strong rally in 2024.
- Recovery: The recovery was rapid. Renewed large-scale purchases by global central banks, along with a resurgence of geopolitical risk, drove gold to new records above $4,300 by October 2025 (12).
Concluding Analysis
The seven corrections over the past decade illustrate gold's cyclical nature within a secular bull market. The data clearly shows that these downturns, averaging 14-15% over 4-6 months, were primarily triggered by periods of tightening monetary policy (rising real rates) and U.S. dollar strength. However, in each instance, the recovery was robust as the long-term structural drivers, including persistent inflation concerns, geopolitical uncertainty, and strong central bank demand, reasserted themselves. This historical pattern suggests that corrections are a normal and recurring feature of the gold market.
Important Disclosures
This commentary is for informational purposes only and should not be considered a recommendation to buy or sell any security or the provision of specific investment advice.
The opinions and forecasts expressed are those of Keaney Financial Services Corp. as of the date of this commentary, are subject to change at any time based on market and other conditions, and may or may not come to pass.
The KFSC Macro Regime Model is a proprietary tool, and its analysis is based on historical data; it does not guarantee future results. Past performance is not indicative of future results.
The rapid fluctuations in commodities will lead to significant volatility in an investor's holdings. Commodities include increased risks, such as political, economic, and currency instability, and may not be suitable for all investors.
All investing involves risk, including the possible loss of principal. Please consult with your financial advisor to determine if the strategies discussed are suitable for your personal financial situation. Consult your qualified financial, legal, or tax advisor before making investment decisions.
References
- World Gold Council. (2024, January 10). Gold market outlook 2024: A look back at previous rate cycles. https://www.gold.org/goldhub/research/gold-outlook-2024-look-back
- Federal Reserve Bank of San Francisco. (2024, March 12). A retrospective on the 2015-2018 tightening cycle. https://www.frbsf.org/economic-research/publications/economic-letter/2024/march/retrospective-2015-2018-tightening-cycle/
- Reuters. (2024, October 5). How markets reacted to the 2016 election and what it could mean for 2024. https://www.reuters.com/markets/how-markets-reacted-2016-election-2024-10-05/
- Bloomberg. (2024, January 11). Geopolitical risk returns as a key driver for gold. https://www.bloomberg.com/news/articles/2024-01-11/geopolitical-risk-returns-as-a-key-driver-for-gold
- Bloomberg. (2024, May 20). Dollar strength and Fed policy: Lessons from 2018. https://www.bloomberg.com/opinion/articles/2024-05-20/dollar-strength-and-fed-policy-lessons-from-2018
- Board of Governors of the Federal Reserve System. (2024, January 15). Review of monetary policy in 2019. https://www.federalreserve.gov/publications/2024-review-of-monetary-policy-in-2019.htm
- The Wall Street Journal. (2024, March 15). Four years later: What we learned from the COVID market crash. https://www.wsj.com/articles/four-years-later-what-we-learned-from-the-covid-market-crash-11647354000
- Kitco News. (2024, August 5). Gold's consolidation patterns: A look back at the 2020-2021 correction. https://www.kitco.com/commentaries/2024-08-05/Golds-consolidation-patterns-a-look-back-at-the-2020-2021-correction.html
- Reuters. (2024, April 12). U.S. bond yields climb as inflation data proves sticky. https://www.reuters.com/markets/us/us-bond-yields-climb-inflation-data-proves-sticky-2024-04-12/
- Bloomberg. (2024, February 28). A look back at the Fed's 2022 hiking cycle. https://www.bloomberg.com/news/articles/2024-02-28/a-look-back-at-the-fed-s-2022-hiking-cycle
- The Wall Street Journal. (2024, March 10). One year after SVB: How the banking scare reset markets. https://www.wsj.com/articles/one-year-after-svb-how-the-banking-scare-reset-markets-11678458000
- World Gold Council. (2025, October 15). Gold market commentary: Central bank buying and geopolitical risk drive new highs.